| Unique Visitors |
Powered By 
| Unique Visitors |
Most VMware admins know by now that auto tiering storage systems should have SIOC configured differently than if they have storage systems that don’t do auto tiering. Especially if it’s auto tiering at block level. It’s also recommended to have IO metric collection disabled because it will get different results based on where the blocks on the datastore physically reside. What you may not know is that VMware has enabled IO metric collection for every datastore by default with ESXi 6.0. This can cause some weird latency spikes on your storage system that can be very hard to isolate if you don’t know what you’re looking for or what might be causing it. So here is how you fix the problem.
If like a lot of people you still primarily use the C# client for vSphere then you will have to switch to a web browser to fix this problem. This will require you log into the vSphere Web Client. Once you are logged in select Storage -> <Datastore> -> Manage. You should see something similar to the following image:

Click on the Edit button and then click the check box next to Disable Storage I/O statistics collection as in the image below:

Click Ok and repeat the process for your other datastores.
If you would like to do the above more automatically by using a PowerCLI Script, please check out this great blog post by Burke Azbill here.
Final Word
Hopefully the above helps you reduce any unexpected latency spikes on your datastores and storage systems you use with ESXi 6.0. As the number of storage systems with auto tiering and multiple storage types increases over time this becomes even more relevant. Given the trends in the industry it is a wonder VMware made this a default setting in the first place. As storage systems become more intelligent there is less and less need for features such as Storage IO Control, which means admins should be able to focus on other more important things, rather than worrying about noisy neighbor problems. FYI, If you are a Nutanix customer this also applies to you. I found this little gem while running an NCC check on a cluster that I was getting periodic unexplained latency spikes. Needless to say the problem has now been resolved after making this change.
This post first appeared on the Long White Virtual Clouds blog at longwhiteclouds.com. By Michael Webster +. Copyright © 2012 – 2016 – IT Solutions 2000 Ltd and Michael Webster +. All rights reserved. Not to be reproduced for commercial purposes without written permission.
Some time ago I wrote about the IO Blazing Datastore Performance with Fusion-io that I was able to achieve with a single VM, connected to a single VMFS volume, and using thin provisioned VMDK’s. Since then a new version of ESXi 5.0 has been released (U2) and some new drivers and firmware have come out for Fusion-io. I was provided an additional Fusion-io ioDrive1 card to go along side the ioDrive2 (both MLC based), and Micron sent me one of their PCIe cards to test (SLC based). So I thought I’d reset the baseline benchmarks with a single VM utilizing all of the hardware I’ve got and see what performance I could get. I was suitably impressed with Max IOPS > 200K and Max throughput >3GB/s in different tests (see graphs below). This baseline will feed into further testing of ioTurbine for Oracle and MS SQL server, which I will write about once it’s done.
Firstly thanks to Bruce Clarke, Simon Williams and Sergey Omelaenko from Fusion-io for arranging the Fusion-io cards (ioDrive1 640GB and ioDrive2 1.2TB) and to Jared Hulbert from Micron for arranging the Micron 320h card (SLC version) and Dave Edwards at Micron for the experimental drivers and setup advice.
Disclosure: Although Fusion-io provided the two ioDrive cards and Micron provided a 320h SLC card on loan for me to test they are not paying for this article and there is absolutely no commercial relationship between us at this time. The opinions in this article are solely mine and based on the test results from the tests I conducted. Due to the Fusion-io ioDrive cards being MLC based and the Micron card being SLC based the testing could be considered an apples to oranges comparison. SLC performance in general is far higher than MLC at a considerable price delta also.
As with the previous testing I used two of the Dell T710 Westmere X5650 (2 x 6 Core @ 2.66GHz) based systems from My Lab Environment, one with 1 x ioDrive2 1.2TB and 1 x ioDrive1 640GB Fusion-io cards installed and the other with the Micron 320h, both systems have the cards installed in 8X Gen2 PCIe slots. I configured the cards as a standard VMFS5 datastore via vCenter with Storage IO Control disabled. I installed the IO Memory Fusion-io VSL driver for the Fusion-io host, and the latest experimental driver I was provided on the host with the Micron card. The hosts are running the latest patch version of ESXi 5.0 U2 build 914586, vCenter is version 5.0 U2. Drivers are also available for vSphere 5.1 for the Fusion-io and Micron cards to be used as a datastore and I will retest at a later date.
I used a single Windows 2008 R2 64bit VM and a single Suse Linux Enterprise Server 11 SP1 VM for the tests. Only one VM at a time was active on the datastore. Each VM was configured with 8GB RAM, 6 vCPU’s, and 4 SCSI Controllers, one for the OS vmdk and the others for the IO Test VMDK’s as depicted in the diagram below. The Windows 2008 R2 VM used LSI Logic SAS for it’s OS disk and PVSCSI for the IO Test disks, whereas the SLES VM used PVSCSI for all disks. IO Load was only placed on the IO Test disks during my testing. The testing of the 2 x Fusion-io ioDrive cards was done by splitting the VMDK’s evenly over both cards to get the combined performance (second image below).
Micron Test VM Configuration:

2 x Fusion-io Test VM Configuration:

Notice in the diagram above I’m using Thin Provisioning for all of the VMDK’s and all of this is going through a single VMFS5 datastore for the Micron or two VMFS datastores in the case of the Fusion-io tests. So if anyone tries to tell you there is a performance issue with Thin Provisioning or VMFS datastores you can point them to this example.
As with the previous tests to generate the IO load I used the VMware fling from VMware Labs IOBlazer. It was very easy to deploy and use and offers a full range of the normal IO testing capabilities you expect, with the additional advantage of being able to replay IO patterns recorded using vscsistats. In my testing I used standard random and sequential read and write IO patterns of varying sizes. In each test I used 12 worker threads (one for each disk). With the exception of the 1M IO Size test where I used 1 outstanding IO, I used 8 outstanding IO’s per worker thread. I did this to limit the amount of IO queueing in the vSphere kernel due to the very small queue depth on the Fusion-io card (32 OIO’s), which wasn’t a problem though on the Micron (255 OIO’s). As a result queuing in the kernel was kept to a minimum to ensure the best possible latency results. For the Micron tests I used a 4K alignment offset to get the best performance, when using 512B alignment the performance wasn’t as good, however this wasn’t a problem with the Fusion-io cards.
Disclaimer
As with the previous tests the IO patterns I tested are not application realistic and do not demonstrate the mix of IO patterns that you would normally expect to see in a real production environment with multiple VM’s or different types sharing a datastore. The tests are for the purpose of demonstrating the limits of the different PCIe Flash cards when used at peak performance with four different fixed IO patterns. I tested 100% read 100% random, 0% read 100% random, 100% read 0% random, and 0% read 0% random. In real production workloads (shared datastore different VM types) you would not normally see this type of IO pattern, but rather a wide variety of randomness, read and write, and also different IO sizes. Except in the cases where one VM has multiple datastores or devices connected to it (big Oracle or SQL databases), in which case some of these patterns may be realistic. So consider the results at the top end of the scale and your milage may vary. Due to the technical differences between the Fusion-io based MLC cards and the Micron based SLC card this isn’t an apples for apples comparison. The tests were limited to short durations (60 seconds), so there was no opportunity to determine how the different cards perform with regard to endurance. Also not all of the cards capacity was used or overwritten during the tests.
Random Read IOPS and Latency

Random Read Throughput

Random Write IOPS and Latency

Random Write Throughput

Sequential Read IOPS and Latency

Sequential Read Throughput

Sequential Write IOPS and Latency

Sequential Write Throughput

Conclusion
Given the differences in technology used between the Fusion-io and Micron PCIe Flash cards this isn’t a valid head to head comparison, it is very much apples to oranges. But what the testing shows is good performance from a single VM. It also shows the capabilities of the vSphere 5.0 hypervisor, especially given the high throughput and low latencies that were achieved. These tests show that vSphere is not an inhibitor to good performance when combined with good hardware.
In all of the tests with the exception of random write performance the single Micron 320h SLC exceeded the performance of the combined Fusion-io ioDrive1 and ioDrive2 cards from the single VM. This demonstrates the performance difference between MLC and SLC more than anything else, and great performance from the hypervisor. Latency was consistently below 1ms for both Fusion-io and Micron up to 16KB – 32KB IO size, at which point throughput saturation was reached. Maximum IOPS of over 200K for the single VM on the Micron card is impressive, especially at < 1ms latency. As is the maximum throughput of over 3GB/s read performance. The Fusion-io cards performed very well during random write tests, and read throughput of 2GB/s is very good. Fusion-io’s read and write IOPS > 100K is also very good.
The only queue depth option on the Fusion-io cards was 32, whereas on the Micron card the queue depth was 255. The difference in queue depth makes a big difference to performance and latency as IO workloads increase, with a larger queue depth the IO’s are not queued up in the kernel and are sent straight to the driver. This assumes the devices can handle the additional IO’s, which PCIe Flash Devices generally can. Don’t try adjusting the queue depth with your SAN arrays without very careful consideration as it can have a negative impact.
Unfortunately the Micron card doesn’t seem to work well at all with the 512B IO size sequential write IO pattern. Though this would be fairly rare in a real production environment where most workload patterns would be random and with larger IO sizes. During testing I also found that write performance suffers greatly on the Micron card when not using 4K aligned writes, as is the case with some other SSD’s. This makes it very important to ensure proper IO alignment at VMFS and Guest OS layer. This is not a problem that the Fusion-io cards suffer from as they handle natively 512B.
Raw throughput and IOPS aren’t the only consideration when it comes to PCIe Flash devices for all workloads. The ability to use the local PCIe Flash Device as near-line memory or cache as in the case of Fusion-io with ioTurbine is a major advantage for business critical applications (such as Oracle and MS SQL databases) and can increase consolidation ratios and therefore ROI without sacrificing performance. Also when using the local PCIe flash as cache in the case of a device failure there won’t be any data loss as writes are committed to the SAN or primary storage, so the only impact is reduced performance.
For some workloads that would be fine on a stand along VMFS datastore, such as floating pool VDI workloads both Fusion-io and Micron are credible choices. Both would also perform well when configured to swap to host cache. The Micron card clearly has an advantage in terms of raw throughput and especially with read performance due to it using SLC technology. One drawback the PCIe flash card models share is that they can’t be configured for RAID in hardware or in vSphere itself. So if you’re going to be using them as a VMFS datastore and storing data on them permanently you have a risk of data loss if the card fails. You should consider application level data protection if using the cards as a datastore, or use them for high performance data where the impact of data loss is low.
In summary all these tests also show us that the VMware vSphere hypervisor is not a bottleneck to storage performance, that VMFS is not a bottleneck to storage performance, and you can get stellar performance even when using thin provisioned VMDK’s. Remembering that none of the cards tested support VAAI the performance is excellent. If you need more performance just add more PCIe flash cards. During the tests the CPU utilization on the VM’s didn’t exceed 80% of the 6 vCPUs, so it’s clear the VM could have sustained higher throughput if the physical hardware could have supported it, and I could have always added more vCPU’s. VMware vSphere definitely is a great platform to run your business critical and high performance applications. I hope you found this interesting and useful and would welcome any feedback as always.
—
This post first appeared on the Long White Virtual Clouds blog at longwhiteclouds.com, by Michael Webster +. Copyright © 2013 – IT Solutions 2000 Ltd and Michael Webster +. All rights reserved. Not to be reproduced for commercial purposes without written permission.
Thanks to Simon Williams (@simwilli) from Fusion-io I’ve had the opportunity to try out a couple of the Fusion-io ioDrive2 1.2TB MLC cards over the past few weeks. I was also provided with ioTurbine software, which combined with an in guest driver acts like a massive read cache and still supports vMotion. ioTurbine’s objective is to allow you to consolidate many more systems on the same server without having to have lots of RAM assigned to act as IO cache to get acceptable performance. This article will focus on the raw IO performance when the Fusion-io IODrive2 cards are used as a datastore. I will follow up with another article on ioTurbine when used with Linux when testing high performance Oracle Databases.
Disclosure: Although Fusion-io provided the two ioDrive2 cards on loan for me to test they are not paying for this article and there is absolutely no commercial relationship between us at this time. The opinions in this article are solely mine and based on the test results from the tests I conducted.
Before I get into the details of my tests I want to say I think Fusion-io has done a great job of making the whole experience of getting their cards fantastic. They come in a very tough black plastic box and just look fantastic. Here is a picture of what the ioDrive2 cards look like that I grabbed off the Fusion-io site. I would have taken an actual photo from my card, but that would have involved taking the server out of the rack.

The ioDrive2 cards come in two different variants. MLC (Multi-level Cell) and SLC (Single-level Cell). The card I’m testing is an MLC. While MLC is slower than SLC it is significantly cheaper. Each cell in an MLC flash device holds multiple bits, compared to only 1 bit of information in an SLC cell. If you want to know more about MLC flash technology there is a great page on Wikipedia – Multi-level Cell. Here are the marketing specifications for the different types of ioDrive2 cards from Fusion-io.

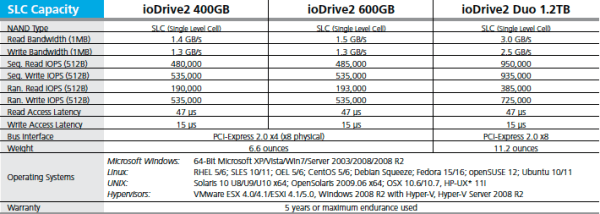
Note: You can have up to 8 of these cards in a system and I’m told the performance will scale almost linearly. That would be good, as you’d need 8 of these cards to get close to reaching the IO performance limits of a single vSphere 5 host!
In my case I only had one card in each system, and even with a single card the performance was good. But it was nowhere near what the marketing numbers suggest, even when using 512B IO size. I will explain my theory as to why this is when I show you the results below.
Before we get to the details of the performance and my test setup I have a complaint. Why publish IOPS figures with a 512B IO Size!? It’s completely useless and completely meaningless. Just because it makes the numbers look big is no excuse. It would be much better to publish figures using an IO size of a typical workload, such as 4K or 8K. But just publishing an IOPS number by itself is also completely useless and of no value. There are a number of other parameters that are required before any of the numbers are of any value whatsoever. To save me from doing a full explanation on this topic I would like to strongly recommend you read the Recovery Monkey article An explanation of IOPS and Latency.
If you are a storage vendor and you actually want to have credibility with your performance figures how about putting in the small print somewhere under what conditions the figures were produced and make the testing of a size and type that is of some value. Unsubstantiated marketing numbers should be met with immediate and severe skepticism from everyone. Ok enough complaining.
For the testing I used two of the Dell T710 Westmere X5650 (2 x 6 Core @ 2.66GHz) based systems from My Lab Environment, each with 1 x ioDrive2 1.2TB Fusion-io card installed in an 8X Gen2 PCIe slot. I configured the cards as a standard VMFS5 datastore via vCenter with Storage IO Control disabled. I installed the IO Memory Fusion-io VSL driver for the ioDrive2 on both of these hosts. The hosts are running the latest patch version of ESXi 5.0 build 768111, vCenter is version 5.0 U1a (U1b has just been released).
I used a single Windows 2008 R2 64bit VM and a single Suse Linux Enterprise Server 11 SP1 VM for the tests. Only one VM at a time was active on the datastore. Each VM was configured with 8GB RAM, 6 vCPU’s, and 4 SCSI Controllers, one for the OS vmdk and the others for the IO Test VMDK’s as depicted in the diagram below. The Windows 2008 R2 VM used LSI Logic SAS for it’s OS disk, whereas the SLES VM used PVSCSI for all disks. IO Load was only placed on the IO Test disks during my testing.
Notice in the diagram above I’m using Thin Provisioning for all of the VMDK’s and all of this is going through a single VMFS5 datastore. So if anyone tries to tell you there is a performance issue with Thin Provisioning or VMFS datastores you can point them to this example.
To generate the IO load I used the VMware fling from VMware Labs IOBlazer. It was very easy to deploy and use and offers a full range of the normal IO testing capabilities you expect, with the additional advantage of being able to replay IO patterns recorded using vscsistats. In my testing I used standard random and sequential read and write IO patterns of varying sizes. In each test I used 12 worker threads (one for each disk). With the exception of the 1M IO Size test where I used 1 outstanding IO, I used 4 outstanding IO’s per worker thread. I did this to limit the amount of IO queueing in the vSphere kernel due to the very small queue depth on the Fusion-io card discussed next. As a result queuing in the kernel was kept to a minimum to ensure the best possible latency results.
Fusion-io Device Queue Depth Limits Performance
The device queue depth for the Fusion-io card was limited to 32. I did try some unsupported tweaks on my hosts to try and increase it to 255 but they were not successful. This is a limitation in the Fusion-io driver and this is very likely to have had a very large impact on the performance results. Don’t get me wrong, the results are still good, but they could well have been much, much better. At a minimum this would have drastically limited the amount of IOPS I can drive through the Fusion-io card. I have raised a feature request to have this configurable up to 255. When I get an updated IO Memory driver I will retest and share the updated performance results.
So why did I test with only a single VM at a time?
Because I knew a single VM would be able to saturate the Fusion-io card based on VMware’s benchmarks for vSphere 5 and discussions I’d had with Fusion-io. Especially during the random read tests we were only expecting up to 100K IOPS, which is well within the capabilities of a single VM in vSphere 5. I did run a couple of tests, just to be sure, with two VM’s going on the same Fusion-io ioDrive2 backed datastore. The overall performance was the same as with a single VM. So at that point I decided doing lots of different combinations of tests with multiple VM’s really wasn’t going to be very valuable.
During VMware’s 1M IOPS Benchmark (using 8KB IO Size and ~ 2ms latency) they noted a single VM could sustain more than 350K IOPS. Based on this and my own testing I was confident the hypervisor wasn’t going to be a bottleneck. The results as you’ll see shortly demonstrate vSphere 5 is capable of supporting almost any application IO workload thrown at it, provided the storage infrastructure is up to the task.
Disclaimer
The IO patterns I tested are not application realistic and do not demonstrate the mix of IO patterns that you would normally expect to see in a real production environment with multiple VM’s or different types sharing a datastore. The tests are for the purpose of demonstrating the limits of the Fusion-io ioDrive2 card when used at peak performance with four different fixed IO patterns. I tested 100% read 100% random, 0% read 100% random, 100% read 0% random, and 0% read 0% random. In real production workloads (shared datastore different VM types) you would not normally see this type of IO pattern, but rather a wide variety of randomness, read and write, and also different IO sizes. Except in the cases where one VM has multiple datastores or devices connected to it (big Oracle or SQL databases), in which case some of these patterns may be realistic. So consider the results at the top end of the scale and your milage may vary.
Read IOPS and Latency
This graph displays the Read IOPS and latency for the different IO sizes tested. Linux was leading the way on both IOPS and latency right up until the 16KB IO size test. Latency didn’t even go above 1ms until the 64KB IO size test. Almost 100K random IOPS at 4KB and 8KB for both Windows and Linux is not bad from a single VM, especially at less than 1ms latency! If the device queue depth was 255 this is where I would have expected to see much higher IOPS as I would have been able to make full use of the larger queue depth without significantly impacting latency.

Read Throughput
This next graph displays the Read Throughput (MB/s) for each of the IO sizes tested. My tuned SLES VM has a slight advantage up unti 32KB IO size, at which point it’s almost a dead heat between the SLES and Windows VM’s. Based on the graph above and below you can see that at 16KB IO size you would be getting over 1200MB/s at under 1ms latency and over 80K IOPS on a single VM.

Write IOPS and Latency
This graph displays the Write IOPS and Latency for the different IO sizes tested. Latency creeped up above 1ms during the 32KB IO size tests. With the exception of random writes on Linux the IOPS performance up till 16KB was over 100K consistently. Again I would have expected much higher IOPS if the device queue depth could have been adjusted up to 255 as I would have been able to make full use of the larger queue depth without significantly impacting latency. Again very good considering this is a single VM and latency is remains below 2ms except with the 64KB and 1MB tests.

Write Throughput
This next graph displays the Write Throughput (MB/s) for each of the IO sizes tested. I hit the throughput saturation point during the 16KB IO size test and it was pretty much a flat line for the subsequent tests.

Based on the list retail prices for ioTurbine and ioDrive2 devices I think these cards are exceptionally good when you compare price for performance and against other options. If you look at the price of an enterprise SSD of a similar size the Fusion-io cards will be slightly cheaper, but offer so much more performance and functionality. If you look at the IOPS and throughput how much would you need to spend to get this out of your SAN?
These tests have really only just scratched the surface of the capabilities of these cards. When used as an IO cache for VM’s, which still allows vMotion to work, the combination of price, performance and functionality in my opinion is very strong. I’m very much looking forward to performance testing the ioTurbine software and posting an article about that, as well as a business case and real business benefits of it.
Although the workloads tested were not very realistic for most applications they give you a good benchmark of the capabilities of the Fusion-io ioDrive2 1.2TB MLC cards. At least this should give you a more realistic idea compared to the marketing numbers in the case you are using these cards as a datastore. The marketing numbers may be achievable with a VM if the device queue depth wasn’t such a limiting factor. These results also demonstrate the excellent performance of a single Windows and Linux VM at such low latency. This is just further proof that the vSphere hypervisor is not your storage bottleneck. Remember a single vSphere host has been able to do 100K IOPS since v3.5, and a single VM could do 100K IOPS in vSphere 4, with vSphere 5 a single VM can do over 350K IOPS and a host can do 1M IOPS. There was also no performance problem experienced due to use Thin Provisioned VMDK’s for the VM.
I see great use cases for Fusion-io cards as a datastore with VDI (Virtual Desktop) type workloads backing floating desktop pools, for databases that are replicated for protection (Oracle DataGuard / SQL Mirroring), and any network cluster based application that needs local persistent storage. But for performance and VM mobility you can’t go past ioTurbine, the results of which I will share with you when I’ve tested it.
I recommend you read the article I wrote regarding VMware’s 1M IOPS Benchmark vs Microsoft’s 1M IOPS, and also An explanation of IOPS and Latency. Download IOBlazer and give it a try. If you record the IO statistics from your hosts using vSCSIStats then you can replay them in IO Blazer and do some very realistic IO benchmarking and testing.
Josh Odgers has also just written up an article where he’s tested the Fusion-io ioDrive2 cards on Older IBM 3850 M2 system – FusionIO IODrive2 Virtual Machine performance benchmarking (Part 1), it’s definitely worth a read. There is also an article on Who needs a million IOPS for a single VM, which has been published after VMware’s recent vSphere 5.1 performance results – 1 Million IOPS on 1 VM.
I hope you’ve found this useful. As always I greatly appreciate your comments and feedback. I hope to meet a lot of you at VMworld US and Europe.
—
This post first appeared on the Long White Virtual Clouds blog at longwhiteclouds.com, by Michael Webster +. Copyright © 2012 – IT Solutions 2000 Ltd and Michael Webster +. All rights reserved. Not to be reproduced for commercial purposes without written permission.