| Unique Visitors |
Powered By 
| Unique Visitors |
By now most readers will know that Nutanix can scale linearly to meet almost any enterprise data center workload and we have many different models of hardware available with many different hardware vendors. Whether your requirement and deployment blueprint is a few nodes or a block, or a few racks at a time, we’ve proven across more than 10K customers and growing to have a rock solid solution. We were the first and still only hyperconverged vendor to achieve 1 Million IOPS in a Single VM. All of which is great, but what if you have a small use case, a small retail shop (or lots of small retail shops), a home lab, a small test environment. Can Nutanix scale down as well? The answer is yes, and I’d like to share some of the use cases that we’ve been cooking up in the Nutanix Engineering Skunkworks Department (Not a real department, used for dramatic effect).

A couple of years ago one of our engineers at Nutanix came up with the idea to help first responders, local authorities, farmers etc with a drone that could be fully autonomous, controlled over 4G LTE or Wifi, and ran a full Nutanix AHV/AOS stack and OpenStack environment, including control software and analytics. The above image of this fully operational prototype is the result of that work. This is kind of an out there use case, but could you imagine that after a hurricane, flood or earthquake is finished and you need to go looking for survivors, this Drone could be deployed and with an infra red camera identify survivors and their status and send back the GPS coordinates to the forward operations base. This could be done automatically (processing on the Drone at the edge) and the drone could fly a grid and be deployed with many other drones doing the same thing. It could also be used for livestock or crop monitoring and many other use cases. However not everyone will have a use case that requires a Drone like this, so lets look at something that is more widely applicable.
Let me introduce you to Jalapeno. This is the code name of a small form factor Nutanix solution. This was a skunkworks project to see if we could make a small system with a Skylake processor and some decent specs.

This could be suitable for ROBO, home office, edge/IOT, retail, Telco network functions and other types of small use cases. Where something that fits under a desk, in a drawer, in a cupboard, or beside a desk is needed, without having a rack available. While these guys are small, the sure pack a punch.


So how small are they? Here are the specs:

Ok, so you can see they are small, but how powerful are they? You can fit 3 or 4 of these easily on a desk, in a cabinet, they have 4 x 10GbE NIC’s and 4 x 1GbE NIC’s, so networking is no problem. But what about storage, RAM etc? Will they actually be useful for something, like running a bunch of VM’s etc?
The systems are based off the ultra small form factor Supermicro E300-9D-8CN8TP:
REF: https://www.supermicro.com/products/system/Mini-ITX/SYS-E300-9D-8CN8TP.cfm
Note: Please use the specific SKU’s below when getting quotes and ordering from SMC. They have been specifically designed for Nutanix.
These systems pack a serious punch:
So seriously small, but also seriously mighty!! These would be perfect to run Nutanix Community Edition (Go for your life!!), but we also tested them with full versions of AOS with ESXi and AHV (however they are not an officially supported Nutanix hardware model yet).
Here are some of the SKU’s from SuperMicro that you could use to order these beasts!!
SYS-E300-9D-8CN8T-1-NI22 – E300 with 128GB RAM, 2 x SSD (3.94TB Samsung Pm863a) (May need to add on micron m.2 MTFDDAV240TCB)
SYS-E300-9D-8CN8T-3-NI22 – E300 with 128GB RAM, 2 x SSD (1.94TB Samsung Pm863a + Micron m.2 MTFDDAV240TCB)
SYS-E301-9D-8CN8T-1-NI22 – E300 with 128GB RAM, 4 x SSD (3.84TB) + Micron m.2
For home use you might want to get 480GB or 960GB SSD’s.
As part of the process of creating these nodes we helped SMC create a new bracket to hold the SSD’s and modify the case to allow for up to 4 SSD’s per node. These wasn’t part of the original SMC design, but I’m glad to report it is now part of their standard SKU’s. It was great seeing the work the skunkworks engineering team and SMC did to create this solution.
Final Word
As I stated before, the small E300 nodes are not officially supported for production use, they are not a Nutanix node that you can buy from Nutanix. However you can buy them, and Nutanix Community Edition will work great on them. If you think we should have these as an officially supported Nutanix solution and you see a massive demand for this type of solution for your business, or someone you know (perhaps a large global training provider, large global telco, large global retailer, large global hotel chain???), then please contact your local Nutanix partner or local Nutanix account team and let them know. We can’t make any promises, but we’re using these ourselves internally for our SE’s and training needs and for test labs for some of our engineers. Of course these make great home lab units. You can have 1 node, 3 nodes, or more nodes. The sky is really the limit!
This post first appeared on the Long White Virtual Clouds blog at longwhiteclouds.com. By Michael Webster +. Copyright © 2012 – 2018 – IT Solutions 2000 Ltd and Michael Webster +. All rights reserved. Not to be reproduced for commercial purposes without written permission.
At Nutanix Customers’ and Prospects’ often ask about performance data. There is a lot of performance data published, such as in best practice guides, on third party sites such as the SAP SD Benchmark site (where Nutanix has a published certified SAP 2-Tier benchmark), and on blogs such as this. We are able to readily provide insightful data across a wide range of applications, systems and situations. Yet there are still people that say for some reason that we don’t publish performance data (maybe their GoogleFoo is weak?). Nutanix performance is more than just latency and IOPS, we analyze real application characteristics. It’s about time this was resolved with a third party vetted report.
Nutanix has worked with ESG and had them independently review and provide a report on the performance of the Nutanix architecture and platform using real applications as the basis of the analysis. Andy Daniel (at PernixData before joining Nutanix in the acquisition) has done a great job of pulling together the various parties, including my team, to contribute to the work. Andy explains the basis of the testing in his article here, and thanks to Mike Leone from ESG for his expert analysis.
We use real applications because customers run real applications and a micro benchmark isn’t a production application. Martijn Bosschaart explains very well the why of this testing method in his article To Finish First, You First Have To Finish. The applications included cover Microsoft SQL Server, Oracle, Exchange and XenDesktop for VDI. The report shows the typical performance that can be expected from the platforms under testing, some of which are not the latest generation, so performance is likely to have improved on the latest models. The report also shows the predictability and consistency of performance across the test scenarios. If you are interested in the performance of the Nutanix platforms I would highly encourage you to review the ESG Lab Review – Performance Analysis: Nutanix. Hopefully this report can clarify any performance concerns that customers, partners and prospects have.
Final Word
Performance isn’t just one element, it is the result of a whole set of elements across a business solution and should be considered when things are going well, in addition to when things are not going well. It should include upgrades, failed components, recovery operations, and provisioning times and other elements. All of these are part of measuring the success and performance of a business solution. In the absence of specific requirements and a specific solution to a business problem benchmarks and other performance data can give an indication of how a platform might perform or behave under certain specific scenarios. But it’s important to be able to relate those scenarios back to your individual requirements. Dheeraj Pandey, Nutanix CEO, explains how Nutanix is different in many ways to other HCI players in his Quora article. It can be quite nuanced, and architectural decisions of the core platform really make a difference, when things are going well, and when things are not going so well.
The Nutanix team is available to help answer any customer/partner/prospect questions on this report or any other topic relating to the Nutanix platform.
This post first appeared on the Long White Virtual Clouds blog at longwhiteclouds.com. By Michael Webster +. Copyright © 2012 – 2017 – IT Solutions 2000 Ltd and Michael Webster +. All rights reserved. Not to be reproduced for commercial purposes without written permission.
It was about this time in 2013 that Michael Corey, Jeff Szastak and I started writing Virtualizing SQL Server with VMware: Doing IT Right (VMware Press) 2014. Microsoft SQL Server was the single most virtualized business critical app in the world then, and it is still the case today. Our book is still as relevant today as it was when we published it and the recommendations we documented still hold true. In spite of it being the most popular critical app to virtualize there are still a lot of cases where some simple best practices are not followed. Best practices that could greatly improve performance. Not all of the best practices apply to all database types at all times, so some care is required. One thing we’ve learned with experience is that the only similarity in customers’ database environments is that they are all different. So this article will focus on the top 5 things you can do to improve performance for many different types of databases and give some examples from performance testing that my team and I have done.
SQL Server Memory Management – Max Server Memory, Reservations, Lock Pages, PageFile
SQL Server, like any RDBMS is really a big cache for data at the end of your storage, regardless of what storage is under the covers. Allocating the right amount of memory to the SQL Server Instance, and ensuring the Operating System has enough memory so it doesn’t cause swapping, are our primary goals. Then we need to look at protecting the SQL Buffer Cache from paging and protecting the VM memory. Paging of the database buffer cache can cause sever performance problems for a busy database server.
Max memory should be changed from the default of 2PB to a value that allows the OS some breathing room. On small SQL Server VM’s with only 16GB or 32GB RAM setting Max Memory to Allocated Memory – 4GB is a good place to start. For larger VM’s the OS may need 16GB or 32GB, and this can be impacted by the number of agents and other tools you have running in the OS. I have seen recommendations that you should leave 10% available for the OS, however this becomes problematic if your VM has a lot of RAM, say 512GB to 2TB.
Reserve the memory assigned to the SQL VM. This guarantees the service levels to the SQL Database, ensures that at least from a memory standpoint it will get the best performance possible, and it will mean the hypervisor page file will not take up any valuable storage. For SQL server VM’s > 16GB memory, and where lock pages are used this is even more critical as hypervisor ballooning is not effective.
Enable the local security policy “lock pages in memory” for the SQL Database service account and set trace flag -T834. This will ensure that the SQL Server instance uses huge pages on the operating system and it protects the database from any OS swapping, as huge pages can’t be swapped. This also reduces the work the OS needs to do with regard to memory management. Huge pages on x86 are 2MB in size, vs the standard 4KB page size that is used by default. Using this setting also prevents ballooning from impacting the SQL Server Instance and is another reason to reserve the memory.
I recommend that you allocate a pagefile big enough for a small kernel dump at minimum, and up to 16GB to 32GB as maximum. If you design your SQL Server VM properly you will not have any OS paging, therefore you shouldn’t need a large pagefile. If you are designing a template that will be used for multiple different sized SQL VM’s then you could consider setting the pagefile to a standard size of 16GB and leaving it at that. The less variation required the better. By reserving the VM memory, locking pages in memory and using -T834 the buffer cache of the DB can’t be paged anyway. These settings will ensure the best possible service level and performance for your database at least in memory.
Split User DB Datafiles and TempDB Across Drives and Controllers
This applies especially to high performance databases. SQL Server can issue a lot of outstanding IO operations and this can cause the queue of a particular drive to become full and prevent the IO’s from being released to the underlying storage for processing. To help alleviate this for large high performance databases you should create the databases with more than one data file (recommended 1 per vCPU allocated to the DB), and allocate each datafile on a different drive. If you have many smaller and less high performance databases you can simply split the database data files across more drives or mount points if you determine a single drive does not provide sufficient performance.
For TempDB the recommendation is 1 datafile per vCPU up to 8 initially and then grow 4 at a time from there as needed. The process of allocating datafiles to TempDB has been automated in SQL Server 2016 so it will choose the correct initial number based on the number of vCPU’s allocated. The reason for doing this is to prevent GAM and SGAM contention.
Each virtual drive and each virtual controller has a queue depth limit, so splitting the datafiles across controllers also helps to eliminate bottlenecks. In a VMware environment you can use up to 4 virtual SCSI controllers, such as PVSCSI and it would be recommended to split the data files across them. You can also tune each controller queue depth by changing registry settings, but be aware of the potential impact on your back end storage. Having really large individual drives / virtual disks might give you extra capacity but it gives you no more performance as the queue depth per device is always limited. This is also the case in cloud environments such as Azure and aligns with Microsoft SQL CAT recommendations.
The image below shows one such design that may be appropriate for splitting data files. This example uses mount points, but you could also use drive letters.
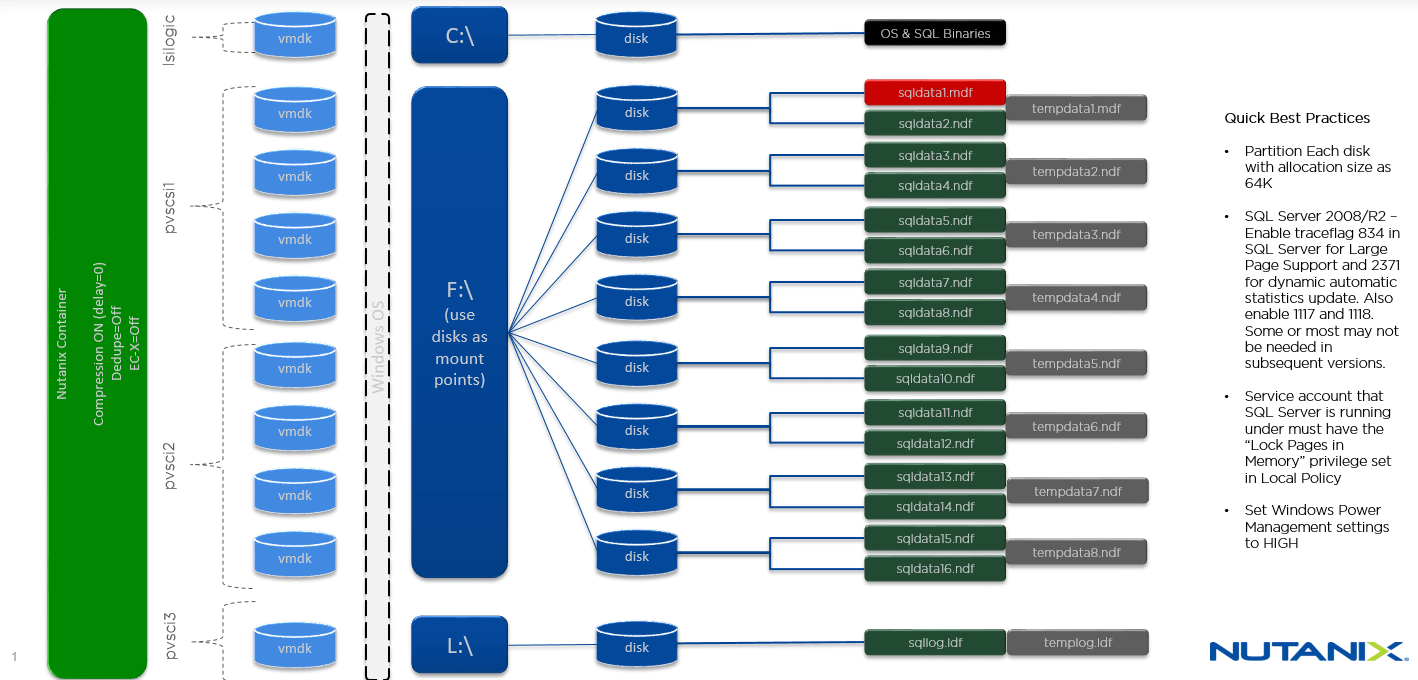
Thanks to Kasim Hansia and Nutanix for the above image.
CPU Sizing, NUMA and MaxDOP
When it comes to CPU sizing for your database VM’s the best size is one that fits within a NUMA boundary. So for a two socket platform this would be a size that fits within a single socket or is easily divisible by the number of cores in a single socket. If you have very large physical servers currently with many databases on them, chopping them up into smaller size VM’s that fit within a NUMA node will help improve performance. The best size of a VM on a system with 8 cores per socket would be 2, 4, or 8 vCPU as an example. In terms of CPU overcommitment a 1:1 vCPU to pCPU core ratio is recommended to start with unless you have a good knowledge of actual system performance, at least for critical production systems, for dev/test a higher ration can be used to start. You can modify increase the ratio as you monitor actual system performance. Production systems general run between 2:1 and 4:1 realistically assuming not all database instances and VM’s running on the host or cluster need the same resources at exactly the same time. You need to design for peak workloads demands and then the averages will take care of themselves.
For very large databases this may not be possible and in that case it is ok to have a VM that spans NUMA nodes as Windows and SQL Server are NUMA aware and will use the processors available to them assuming the correct license, however the scaling of processors across NUMA boundaries in a single VM doesn’t provide linear performance, whereas splitting multiple smaller databases across multiple smaller VM’s that do fit within NUMA boundaries can provide better performance than would otherwise be available on a single physical OS or VM. When it comes to memory and NUMA, more is better for databases and as memory is so much faster than disk or SSD or even NVMe, the penalty for having memory in different NUMA nodes when virtual NUMA is available is not a concern.
With regards to the SQL Server setting Maximum Degree of Parallelism that controls the number of threads or processors that a single query can consume, you need to be careful with modifying it. For OLTP transactional type databases you can get significant performance gains overall when large numbers of users are concurrently accessing the system if MaxDOP is set to a small number or 1, however it is a global setting on the SQL Server instance in versions before 2016 and therefore will impact all databases on an instance. A good rule of thumb may be to set it to an the size of a NUMA node, or some number of processors you are happy to be consumed by a single query. In SQL Server 2016 you can set it per database, so it can be more finely tuned to the individual database workloads. Leaving it at the default of 0 i.e. unlimited can also have negative performance impacts especially when many users access a database as a single query could consume all resources and negatively impact other users.
Networking, Live Migration, Jumbo Frames
When it comes to networking you need to consider more than just the user access to the database, you need to consider management workloads including live migration for maintenance and load balancing, backup, monitoring and out of band management. With very large SQL Server VM’s with 512GB and above the live migration network may have some hefty requirements. Especially with very active SQL Server VM’s. I have seen the live migration networks struggle with evacuating a host for maintenance if they were not designed and implemented correctly. If you have hosts with multiple TB of RAM and enough VM’s to occupy that RAM you should consider multiple 10G networks for live migration traffic. Using LACP network configurations can indeed help, as can using Jumbo Frames. As you start adopting 40GbE, 50GbE and above NIC’s the use of Jumbo Frames to increase performance and lower CPU utilization becomes ever more important. You can achieve up to 10% to 15% additional performance by using Jumbo Frames for live migration traffic depending on CPU type and bandwidth of you NIC. But take care as it does need to be implemented properly. It is fortunate that many enterprise class switches now come with Jumbo Frames enabled by default, but you will still need to enable it in your hypervisor and on the life migration virtual NIC. If you are using Jumbo Frames why not enable SQL Server to use a packet size of 8192 bytes instead of the standard 4096 (same size as a database page although there is no direct relationship), 8192 bytes and it fits nicely into the 8972 byte TCP packet (9000 bytes with overhead included) on the wire. Take into consideration the network impacts of any software defined storage solution especially as adopting modern all flash systems because your network may be too slow for flash.
Maintaining an Accurate and Objective Performance Baseline
Maintaining an accurate and objective performance baseline of your databases is the only real way to measure when things are going wrong or when performance is not acceptable. Before, during and after virtualization you should be updating your baslines whenever major configuration changes are made. This prevents the ‘feeling’ that it’s slow, without defining what slow it, or without being able to quantify the feeling. If you can accurately test acceptable performance and repeat that test then you can be sure your system is behaving as expected throughout its useful life. This is not as easy as it sounds, and due to the many hundreds or thousands of databases that most customers have, a risk based approach is recommended. For the most important or highest risk systems it’s worthwhile making the investment into proper baselines and monitoring, for the great unwashed this might not be practical. There are many tools that can help, and they start from industry standard benchmarks and system monitoring tools to more elaborate enterprise test suites. We cover a number of different options in our book, but a simple option might be to use HammerDB, Record and Replay, and/or SCOM/PerfMon. Without a baseline you have no objective way to measure success.
Performance Results With and Without Best Practices
When you’ve been successfully virtualizing SQL Server for years and you know the best practices it is pretty hard to go back and create a database VM with next, next finish and ignore all that you have learned. But that is just what we had to do in order to measure the difference between the default configuration and applying the best practices. In this case we used a VM with 8 vCPU, 32GB RAM and HammerDB. The only difference between the two tests was the configuration of SQL Server and the operating system. The same number of users in HammerDB are used for each test.
Default configuration without best practices applied:

Configuration after best practices have been applied:

Thanks to Bas Raayman and Bruno Sousa for the two images above.
In this example the difference in performance is 12x between the default configuration and the optimized configuration. The benefits grow as you start to scale out the number of VM’s and number of servers, which is what the next image shows.
Here we have a number of database VM’s being scaled our across a number of servers, in this case using Nutanix systems. The performance growth is linear, as you add more VM’s and more Nutanix nodes you get the same performance per node, and linearly scalability of the overall performance in terms of transactions per minute.
#TBT A blast from the past (2014) Scaling 1M MS SQL transactions per #Nutanix node.https://t.co/CDwiVQKMbQ pic.twitter.com/eViiA3b10m
— Gary Little (@garyjlittle) January 26, 2017
Final Word
We have covered a few best practices that can help improve performance and ensure success of any virtualization project. There is significantly more covered in Virtualizing SQL Server With VMware: Doing IT Right (VMware Press 2014). I also had a hand in crafting the Nutanix best practices for SQL Server, which is freely available. Nutanix has published many best practice guides for many applications and a lot of them are applicable regardless of what system you are running. Hopefully applying some of these simple best practices helps improve the performance of your virtualized SQL Server environments. I’d love to hear any feedback or comments you might have.
This post first appeared on the Long White Virtual Clouds blog at longwhiteclouds.com. By Michael Webster +. Copyright © 2012 – 2016 – IT Solutions 2000 Ltd and Michael Webster +. All rights reserved. Not to be reproduced for commercial purposes without written permission.
Some of you may be shocked to know that by default a lot of disk devices in Windows will by default have disk write caching enabled (Better Performance Policy). This can cause data integrity issues if there is a sudden loss of power, or the sudden removal of the device, as most devices are hot plug. Most well written applications should not be impacted by this as they will themselves use forced unit access (FUA) to bypass any write cache and cause the operating system to flush the IO’s before returning to the application and saying it is committed. But experience over the last few years has shown that this can be inconsistently implemented. In my opinion there is no amount of data loss acceptable to improve performance and IO should always be persistent when it is acknowledged back to an operating system or application. With this in mind I decided to do some testing to find out what the impact is of setting the disk devices to Quick Removal, and thereby disabling the default write cache.
Firstly if you don’t know how to check or change the disk removal / disk cache policy there are two places. You can use diskmgmt.msc and go into the disk properties view and then into the hardware tab, which then allows you to view all disks on a system and change the properties and policy there, or you can go into device manager and do the same thing. Here are examples of these two options:


Here is what the Disk Policy should look like when the disk write cache is disabled, and the quick remove policy is selected.

If you have a lot of VM’s or a lot of SQL Server Databases or Exchange systems, that each have a lot of disks it could be quite a major task to change the policy. Fortunately Microsoft has a way using PowerShell to change the policy on multiple disks and multiple remote servers all at the same time. Take a look at Change write caching policy (enable or disable) for multiple disks remotely on Technet.
Now for something I found a bit puzzling, when I turned off the disk write cache, i.e. set the policy to quick removal, I found that performance improved. My theory as to why is that without having to do a cache lookup on read it saves some time, and without having to store and constantly overwrite the write cache, which also takes some time, the IO path is more efficient when quick removal is selected. If anyone knows for sure I would be interested to hear. As for the performance results here are some tests I ran on an all flash setup. The configuration had 8 VM’s each on it’s own host using Nutanix NX9060 All Flash Nodes (6 x SATA-SSD per node, 4RU in total).
8KB IO Size, 64 Outstanding IO, 100% Random Write CacheOn vs CacheOff
Cache On:

Cache Off:

8KB IO Size, 64 Outstanding IO, 100% Random Read CacheOn vs CacheOff
Cache On:

Cache Off:
For those that just like big numbers for throughput and IOPS here is a similar test with cache off and 32KB IO size, 100% Random Read, on the same 8 nodes..

18GB/s total or just over 2.25GB/s per VM, in just 4RU, without any NVMe.
Final Word
Changing the default disk policy in Windows to Quick Removal to disable the Windows disk write cache is a good idea not just for data integrity but also for performance. Even though the tests I ran are not application realistic as they used a synthetic IO generator tool, they were consistent and show the difference between the two settings that I was interested in measuring. The change of disk policy was the only change between the various test runs, of which there were many. Your milage in your environment may vary. But in my book it is never acceptable to have any chance of data loss or data corruption and changing the Windows disk policy to quick removal just makes sense. During the read tests there was no network bandwidth required due to the Nutanix Data Locality feature making all reads local to the server where the application / test VM was running. This allows the platform to scale linearly and to delay investing in higher spec network equipment even when adding a lot more flash or taking advantage of newer flash technologies in the future. NVMe was not used in any tests, when I have some test systems available with NVMe I will rerun some of these test and share the results. This will save you having to do all the hard work yourselves.
This post first appeared on the Long White Virtual Clouds blog at longwhiteclouds.com. By Michael Webster +. Copyright © 2012 – 2016 – IT Solutions 2000 Ltd and Michael Webster +. All rights reserved. Not to be reproduced for commercial purposes without written permission.
Kevin Closson’s Silly Little Oracle Benchmark, aka SLOB, is a great free tool to test the IO capability of an OLTP type system based on small 8KB IO, with varying IO patterns (update percentages). It uses the database engine to generate the IO, to provide an understanding of the possible IO capability of the platform, and what the database sees from the underlying infrastructure. By using AWR reports you can measure the IO throughput and latency of the database after each test and use that as a comparison when making changes. The purpose of using SLOB is to test the underlying infrastructure, not to test the database software itself. This article will cover example SLOB and Guest OS configurations used to test two different versions of Nutanix AOS software in an all flash cluster. The only changes between the sets of tests was the Nutanix AOS software to demonstrate the difference in performance that may be achieved by a simple one click upgrade from AOS 4.7 to AOS 5.0. SLOB is used as it is an easy way to set up a repeatable and measurable test.
I had first written about using SLOB in my article All Flash Performance on Web Scale Infrastructure. The tests there were based on using a single 2 Node Oracle RAC Cluster to drive load, whereas the test I have done for this article are using multiple Oracle Database VM’s and scaling out across multiple servers. The sets of tests demonstrate the linearity of performance scaling available in the Nutanix platform, which is very predictable. As you add more resources (nodes and VM’s), you get more performance.
There were 4 or 8 Oracle database single instances VMs. The VMs were installed with RHEL 7.2 x86_64 with 12 vCPU and 32GB of memory.
Disk Configuration for Each VM
Each VM was installed with Oracle Grid Infrastructure 12.1.0.2 and Oracle database software 12.1.0.2. Below is the initialization parameter was used for the SLOB database.
| *._db_block_prefetch_limit = 0
*._db_block_prefetch_quota = 0 *._db_file_noncontig_mblock_read_count = 0 *.audit_file_dest=’/u01/app/base/admin/SLOB1DB/adump’ *.audit_trail=’db’ *.compatible=’12.1.0.2.0′ *.control_files=’+DATADG/slob1db/controlfile/current.256.915710191′ *.db_block_size=8192 *.db_create_file_dest=’+DATADG’ *.db_domain=” *.db_name=’SLOB1DB’ *.diagnostic_dest=’/u01/app/base’ *.dispatchers='(PROTOCOL=TCP) (SERVICE=SLOB1DBXDB)’ *.filesystemio_options=’setall’ *.db_files=2000 *.processes=8000 *.shared_pool_size=4G *.db_cache_size=1536M *.parallel_max_servers=0 *.log_buffer=134217728 *.pga_aggregate_target=10G *.remote_login_passwordfile=’EXCLUSIVE’ *.undo_tablespace=’UNDOTBS1′ *.local_listener=’LISTENER_SLOB1DB’ |
Here is the /etc/sysctl.conf was used during this test
| # oracle-rdbms-server-12cR1-preinstall setting for fs.file-max is 6815744
fs.file-max = 6815744 # # oracle-rdbms-server-12cR1-preinstall setting for kernel.sem is ‘250 32000 100 128’ kernel.sem = 250 32000 100 128 # # oracle-rdbms-server-12cR1-preinstall setting for kernel.shmmni is 4096 kernel.shmmni = 4096 # # oracle-rdbms-server-12cR1-preinstall setting for kernel.shmall is 1073741824 on x86_64 kernel.shmall = 1073741824 # # oracle-rdbms-server-12cR1-preinstall setting for kernel.shmmax is 4398046511104 on x86_64 kernel.shmmax = 4398046511104 # # oracle-rdbms-server-12cR1-preinstall setting for kernel.panic_on_oops is 1 per Orabug 19212317 kernel.panic_on_oops = 1 # # oracle-rdbms-server-12cR1-preinstall setting for net.core.rmem_default is 262144 net.core.rmem_default = 262144 # # oracle-rdbms-server-12cR1-preinstall setting for net.core.rmem_max is 4194304 net.core.rmem_max = 4194304 # # oracle-rdbms-server-12cR1-preinstall setting for net.core.wmem_default is 262144 net.core.wmem_default = 262144 # # oracle-rdbms-server-12cR1-preinstall setting for net.core.wmem_max is 1048576 net.core.wmem_max = 1048576 # # oracle-rdbms-server-12cR1-preinstall setting for net.ipv4.conf.all.rp_filter is 2 net.ipv4.conf.all.rp_filter = 2 # # oracle-rdbms-server-12cR1-preinstall setting for net.ipv4.conf.default.rp_filter is 2 net.ipv4.conf.default.rp_filter = 2 # # oracle-rdbms-server-12cR1-preinstall setting for fs.aio-max-nr is 1048576 fs.aio-max-nr = 1048576 # # oracle-rdbms-server-12cR1-preinstall setting for net.ipv4.ip_local_port_range is 9000 65500 net.ipv4.ip_local_port_range = 9000 65500 vm.swappiness = 0 |
SLOB Configuration:
The configuration parameters are standard as per the SLOB documentation and README files, but some settings are modified based on the type of test you want to run. The following settings are in slob.conf.
UPDATE_PCT: 30
I used 00, 30, 50, or 100 during various tests based on the percentage of updates required. Note that using 100 as the update percent produces a roughly 50% random write workload. The graphs below are with this set to 30
RUN_TIME: 7200
7200 seconds is 2 hours runtime, enough to get a result under a sustained workload.
THREADS_PER_SCHEMA=1
I used 1 or 2, 1 was used during most runs, I experimented with 2 with higher update percentages to drive more load. The graphs below are from tests with this set to 1.
None of the other settings need to be modified.
To execute a test on each VM using 24 vUsers you run ./runit.sh 24 from the SLOB directory.
Now lets look at some results, which I have graphed for you. The first test is with 4 VM’s on 4 Nodes, followed by 8 VM’s on 8 Nodes. This shows the increase in performance when scaling a configuration. During the test all data reduction features are enabled. Data Checksums are always enabled and can’t be disabled, unlike some competing platforms. All the VM’s and storage used in these tests take up just 4 rack units. The SSD’s used in the All Flash Nutanix nodes are standard Intel S3610 SATA-SSD’s, no NVMe or anything exotic is used. When NVMe platforms are available we will repeat the tests and share the results.
Nutanix AOS 4.7 Performance with Oracle SLOB:

Nutanix AOS 5.0 Performance with Oracle SLOB:

The only difference between the above tests was the version of Nutanix AOS software running on the cluster. No hypervisor version upgrade is required between tests to achieve better performance. Average read and log file write latency were fairly good and fairly linear. CPU utilization across the nodes was ~ 60% during the tests and more performance was available, so these test do not represent peak performance by any means. Scaling up to 2 VM’s per node almost doubled IO performance, at the cost of some additional latency as workload increases. The hardware used during the test had the Intel Xeon v3 processors, which are Haswell, the latest generation is v4 Broadwell. If the same tests were repeated on Broadwell it would be expected to show approximately a 15% improvement in performance. Software defined storage benefits not only from software improvements but also improvements in system and CPU performance improvements. Which means you can have continuing performance improvements at a much faster rate than on traditional infrastructures.
I decided to record similar images from my previous article from Oracle Enterprise Manager Express while testing against a 4 Node Oracle RAC cluster using SLOB, but this time a 100% read test (UPDATE_PCT=00). Each RAC Node VM was configured with 24 vCPU and 32GB RAM. The results were as follows:


Instead of using standard virtual disks with the Oracle RAC Nodes in these tests I used Nutanix Acropolis Block Services and in-guest iSCSI initiator to connect to 40 iSCSI LUN’s that are distributed and load balanced across the Nutanix cluster. By doing this it allows a small number of VM’s, in this case 4 x Oracle RAC Nodes, to benefit from a larger number of storage controllers and therefore increased overall performance. There is a cost to latency however due to the partial loss of data locality for the transactions that need to go over the network. Acropolis Block Services allows either VM’s or External Physical OS (Oracle Linux, Oracle VM, Windows and other Linux variants) to benefit from the Nutanix environment.
Final Word
As with a lot of tests these were conducted in a controlled environment that isn’t subject to the random noise of a production environment, and while nothing else was consuming resources of the systems used in the test. As a result your milage in real world environments will be different. However under the same conditions, with the same configuration, you should be able to reproduce the same or similar results. There are more factors involved in selecting a platform than just performance. These results compare very favorably to other published HCI SLOB results, especially on latency, which is significantly lower. I partnered with Mellanox on the switching hardware for this environment. Their switches produce predictable latency and performance across a variety of message sizes. You can read more about Mellanox switching solutions for Nutanix environments here. For general performance information about Nutanix please see Raising the Bar and Pushing the Envelope on Performance.
This post first appeared on the Long White Virtual Clouds blog at longwhiteclouds.com. By Michael Webster +. Copyright © 2012 – 2016 – IT Solutions 2000 Ltd and Michael Webster +. All rights reserved. Not to be reproduced for commercial purposes without written permission.